The story5 decisions · original frames
Frames from the original case · interface in Ukrainian01Plan
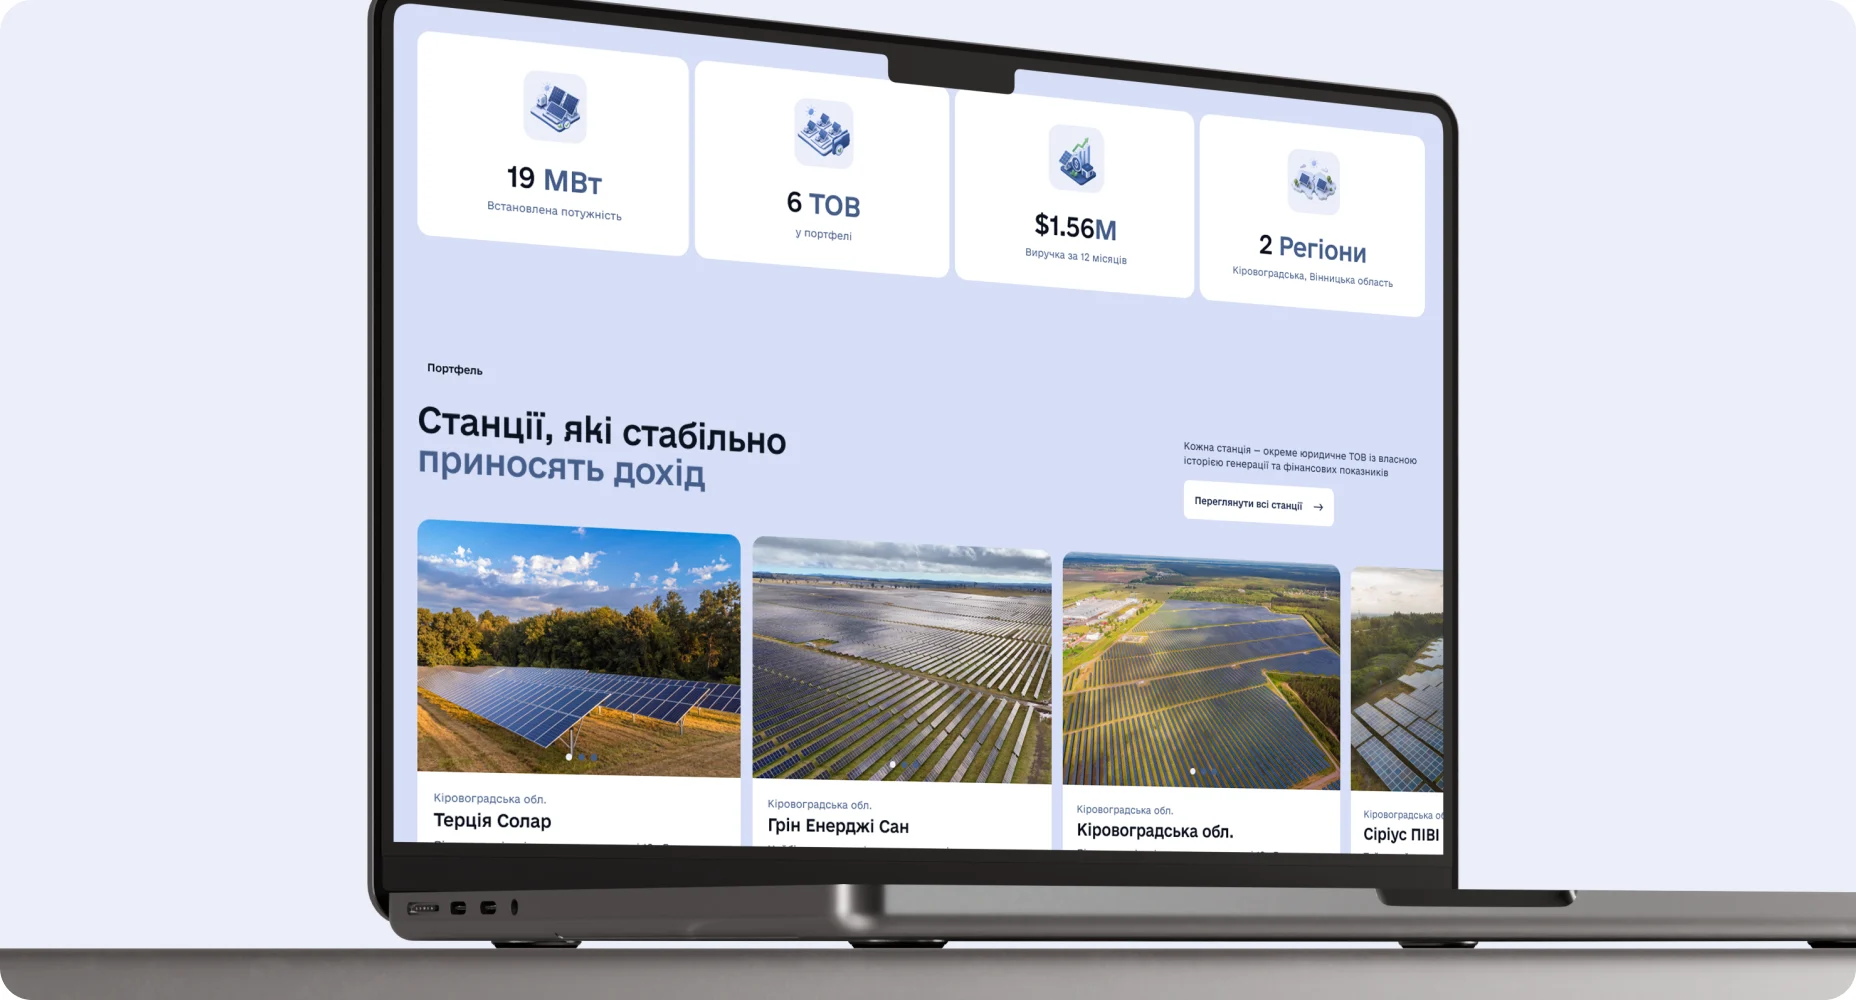
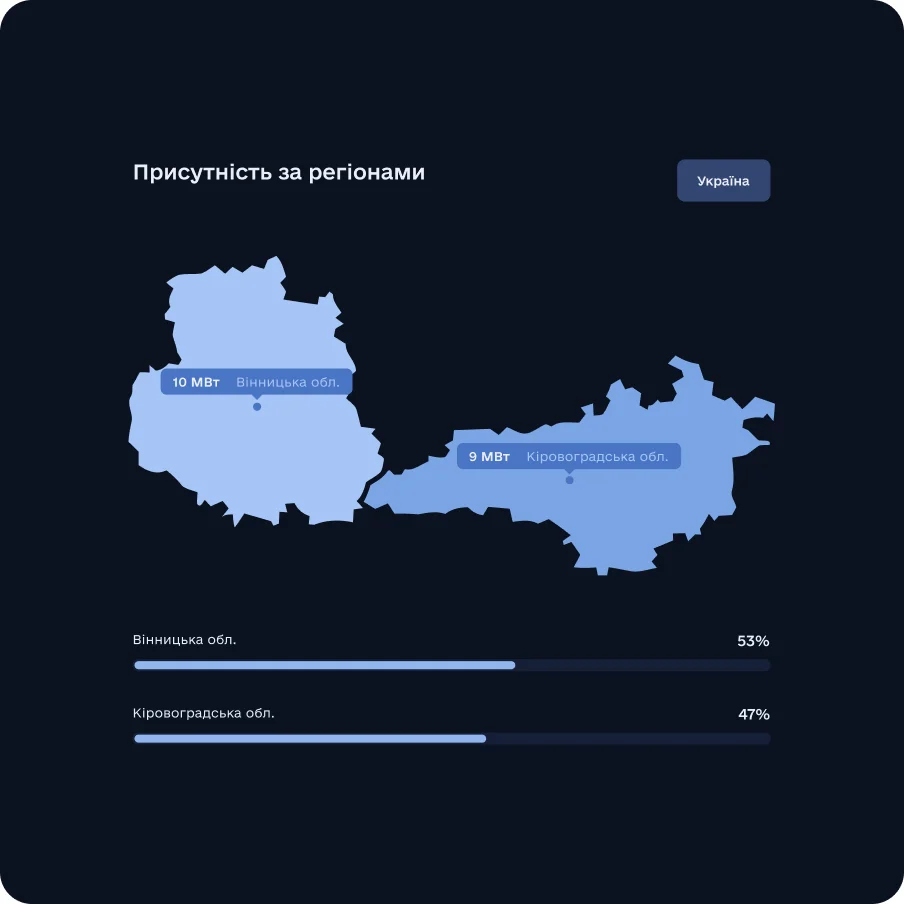
19 MW, 6 companies, $1.56M in revenue.
These figures became the backbone of the website structure, set at the wireframe stage.
02Identify
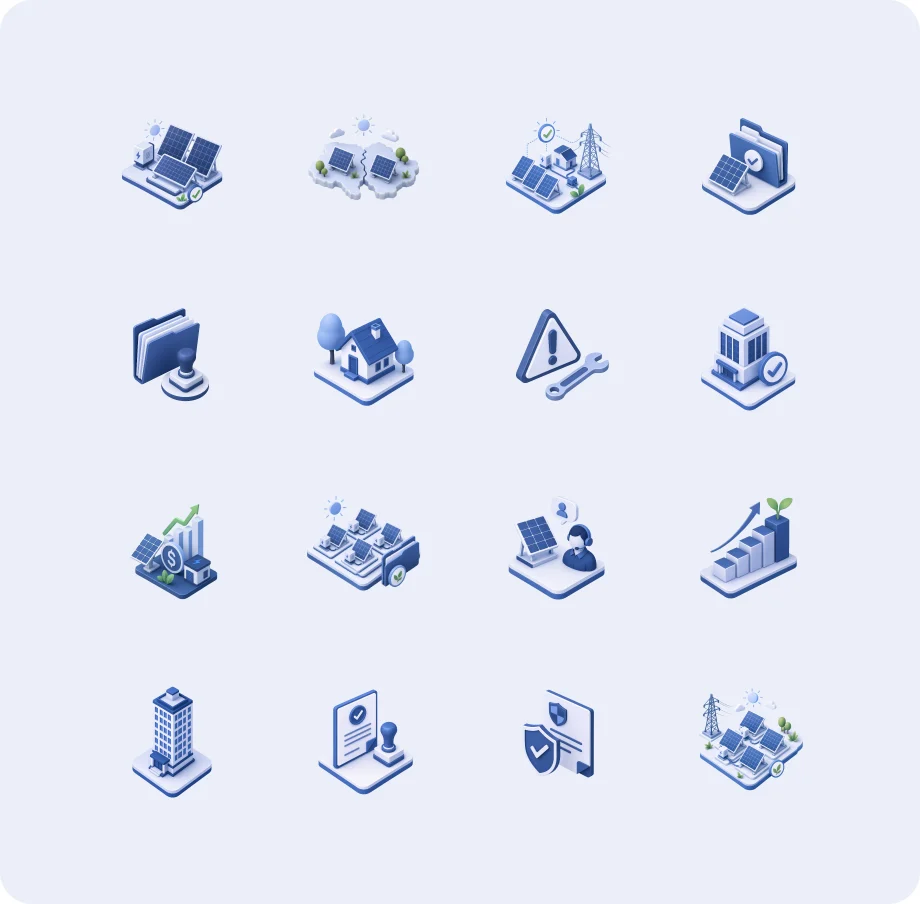
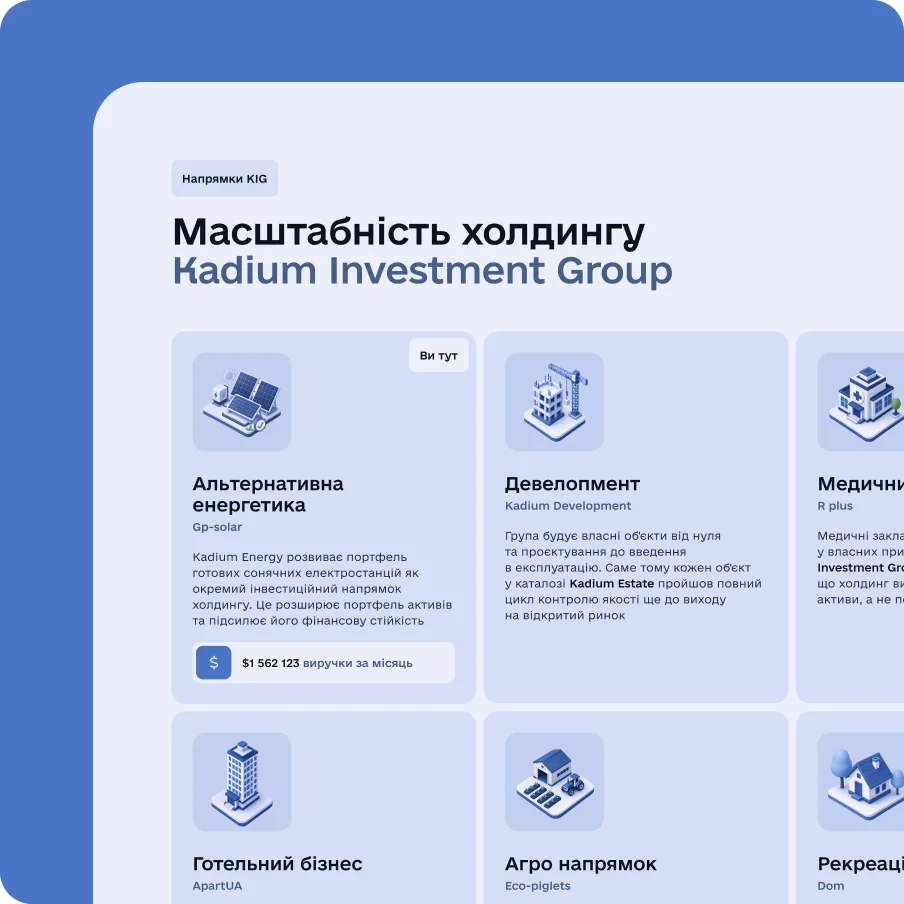
A mark and icons that explain the business.
A distinctive icon set communicates the purpose of each part of the project at a glance.

03Detail
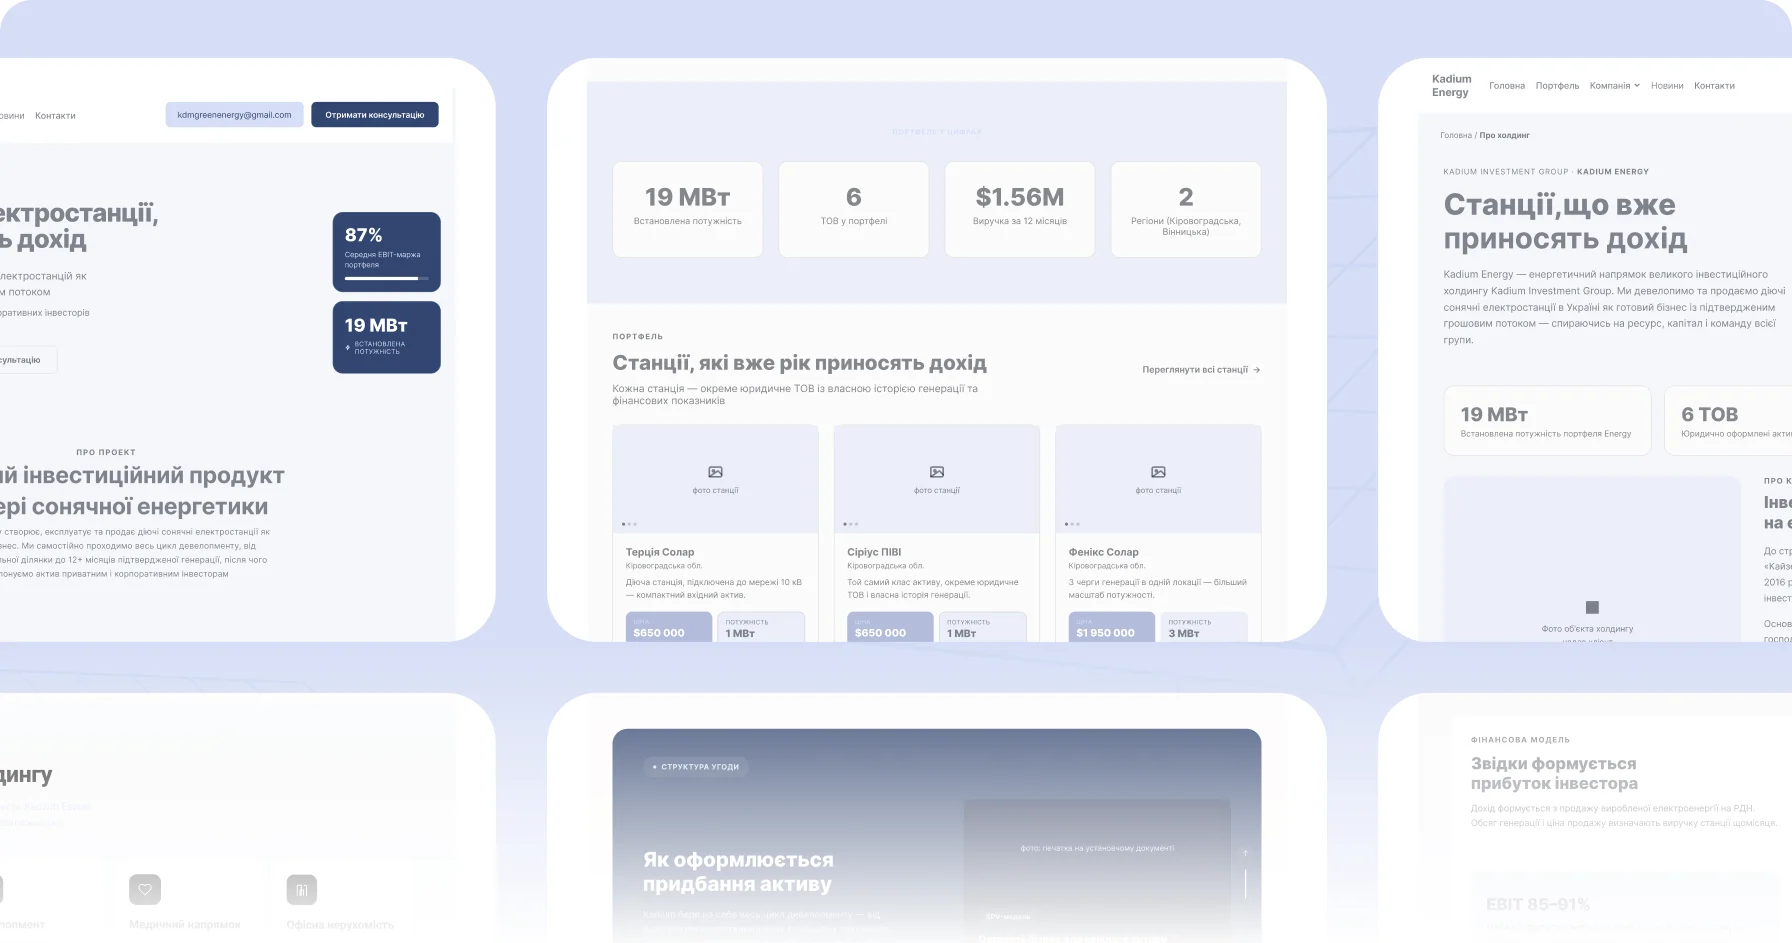
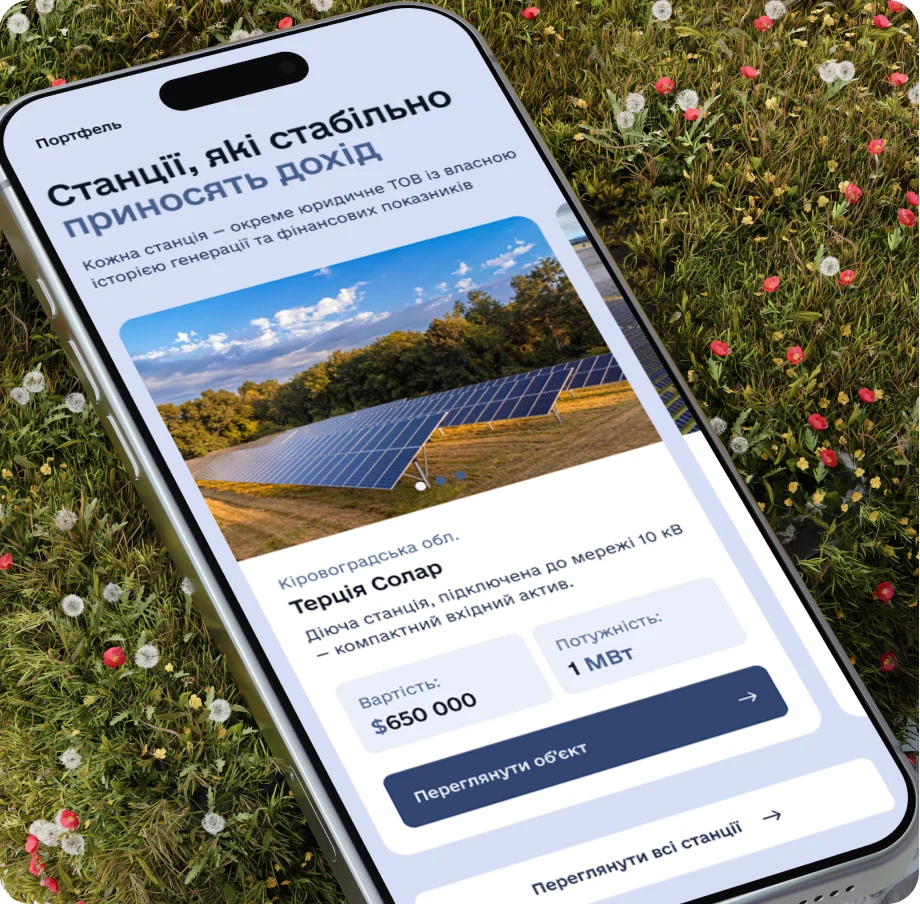
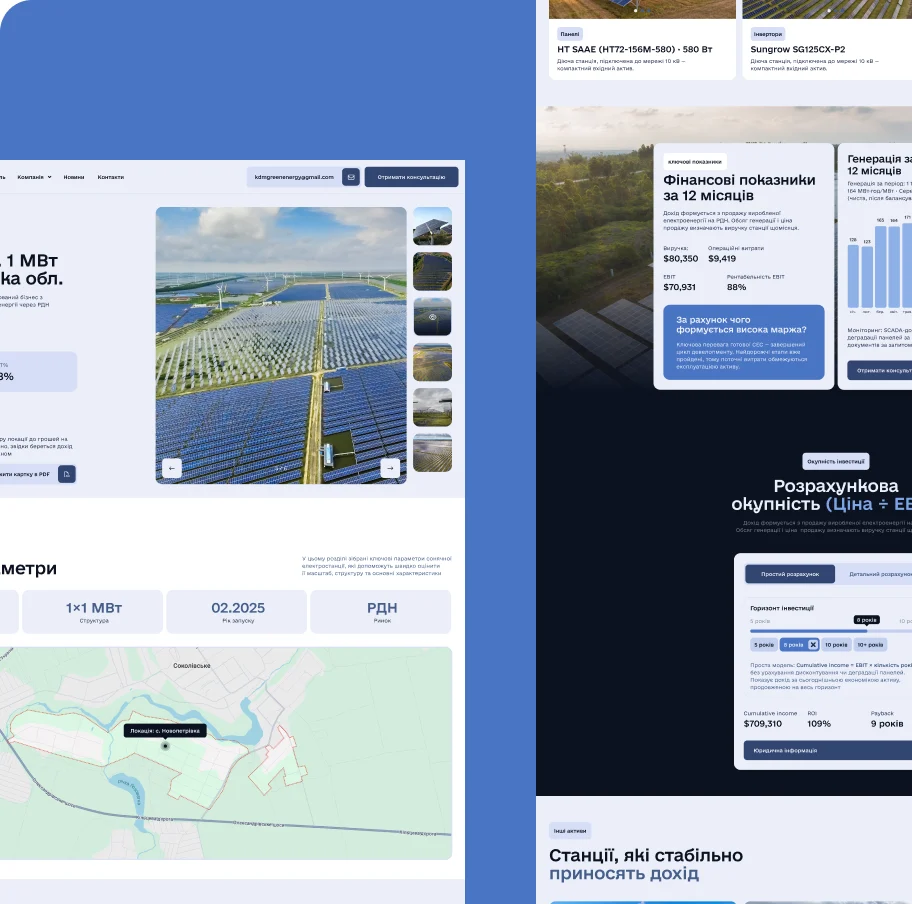
A page for every plant.
Each solar plant has its own page with capacity, revenue and EBIT margin.
04Find
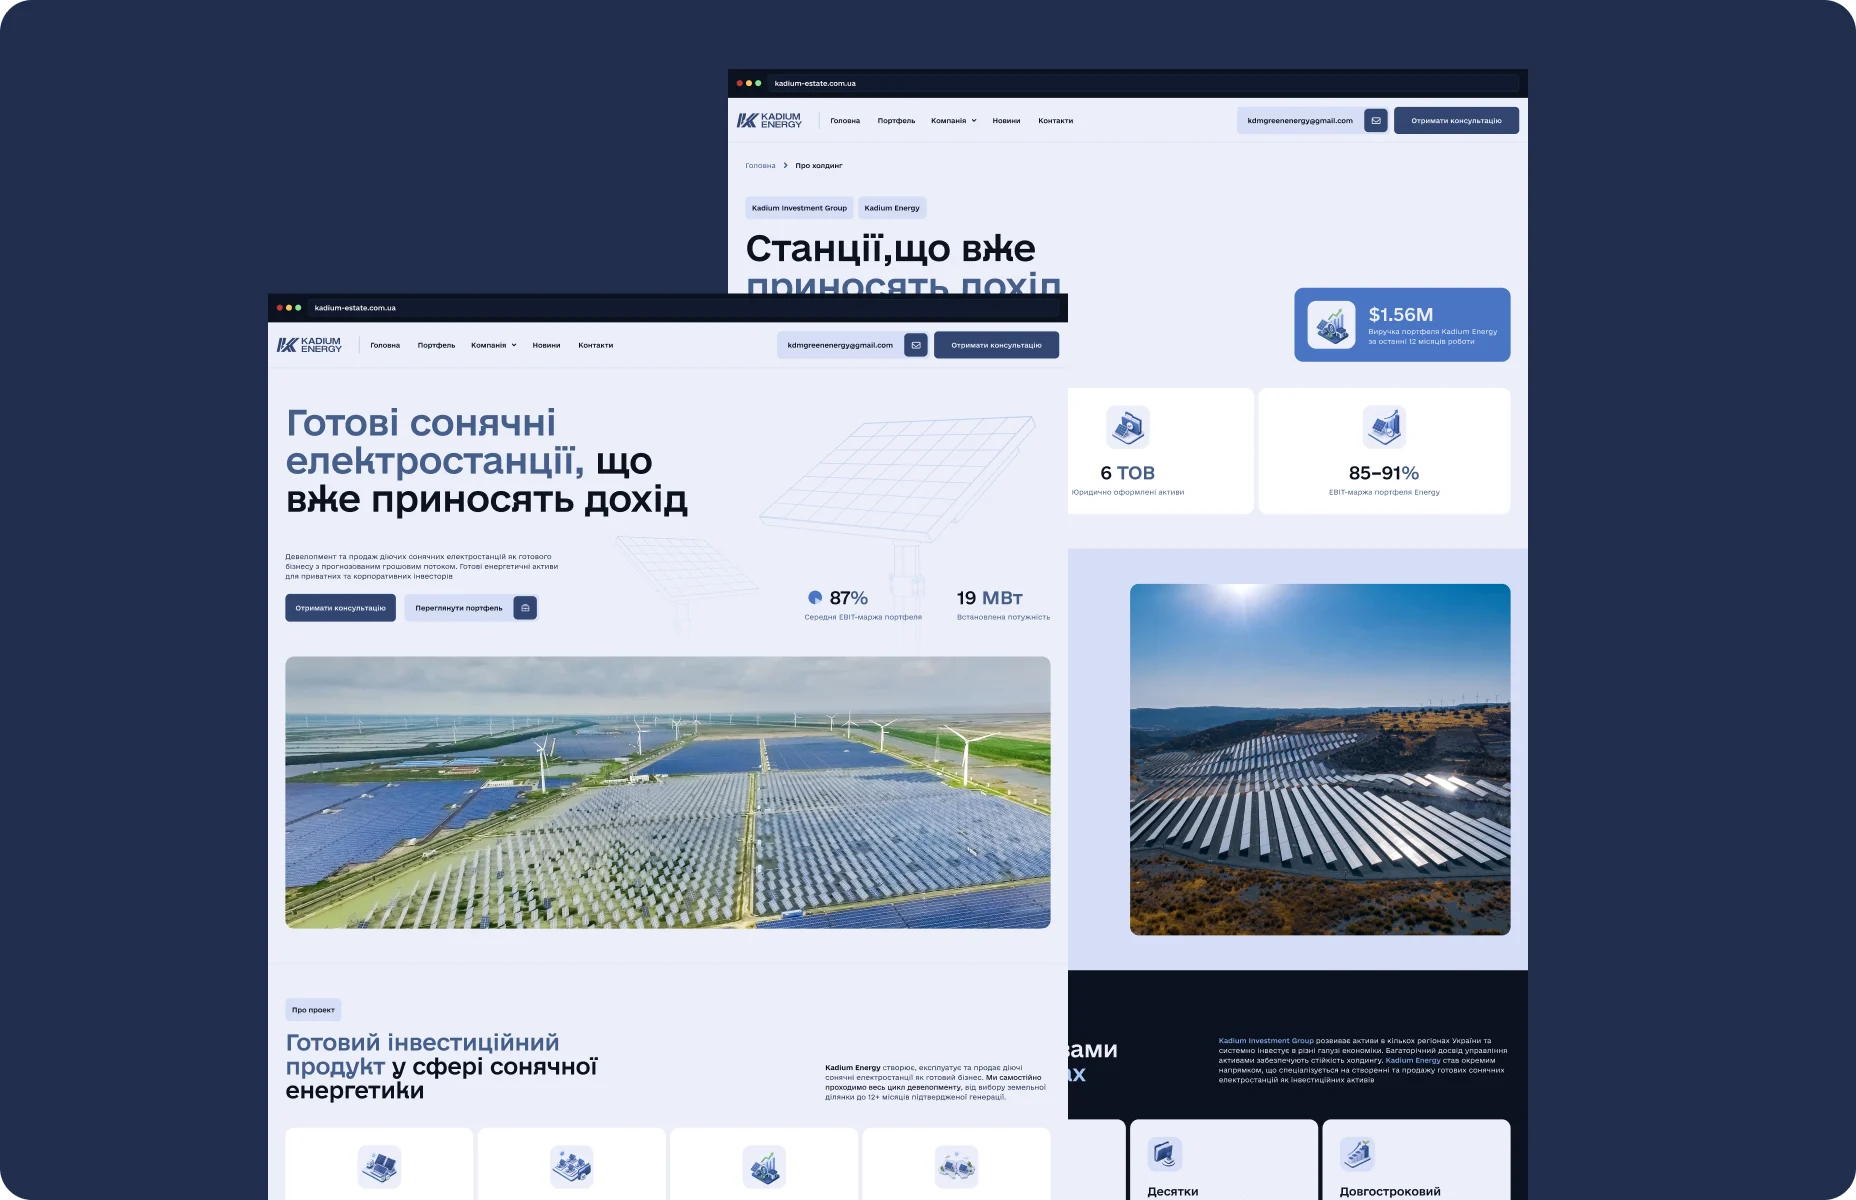
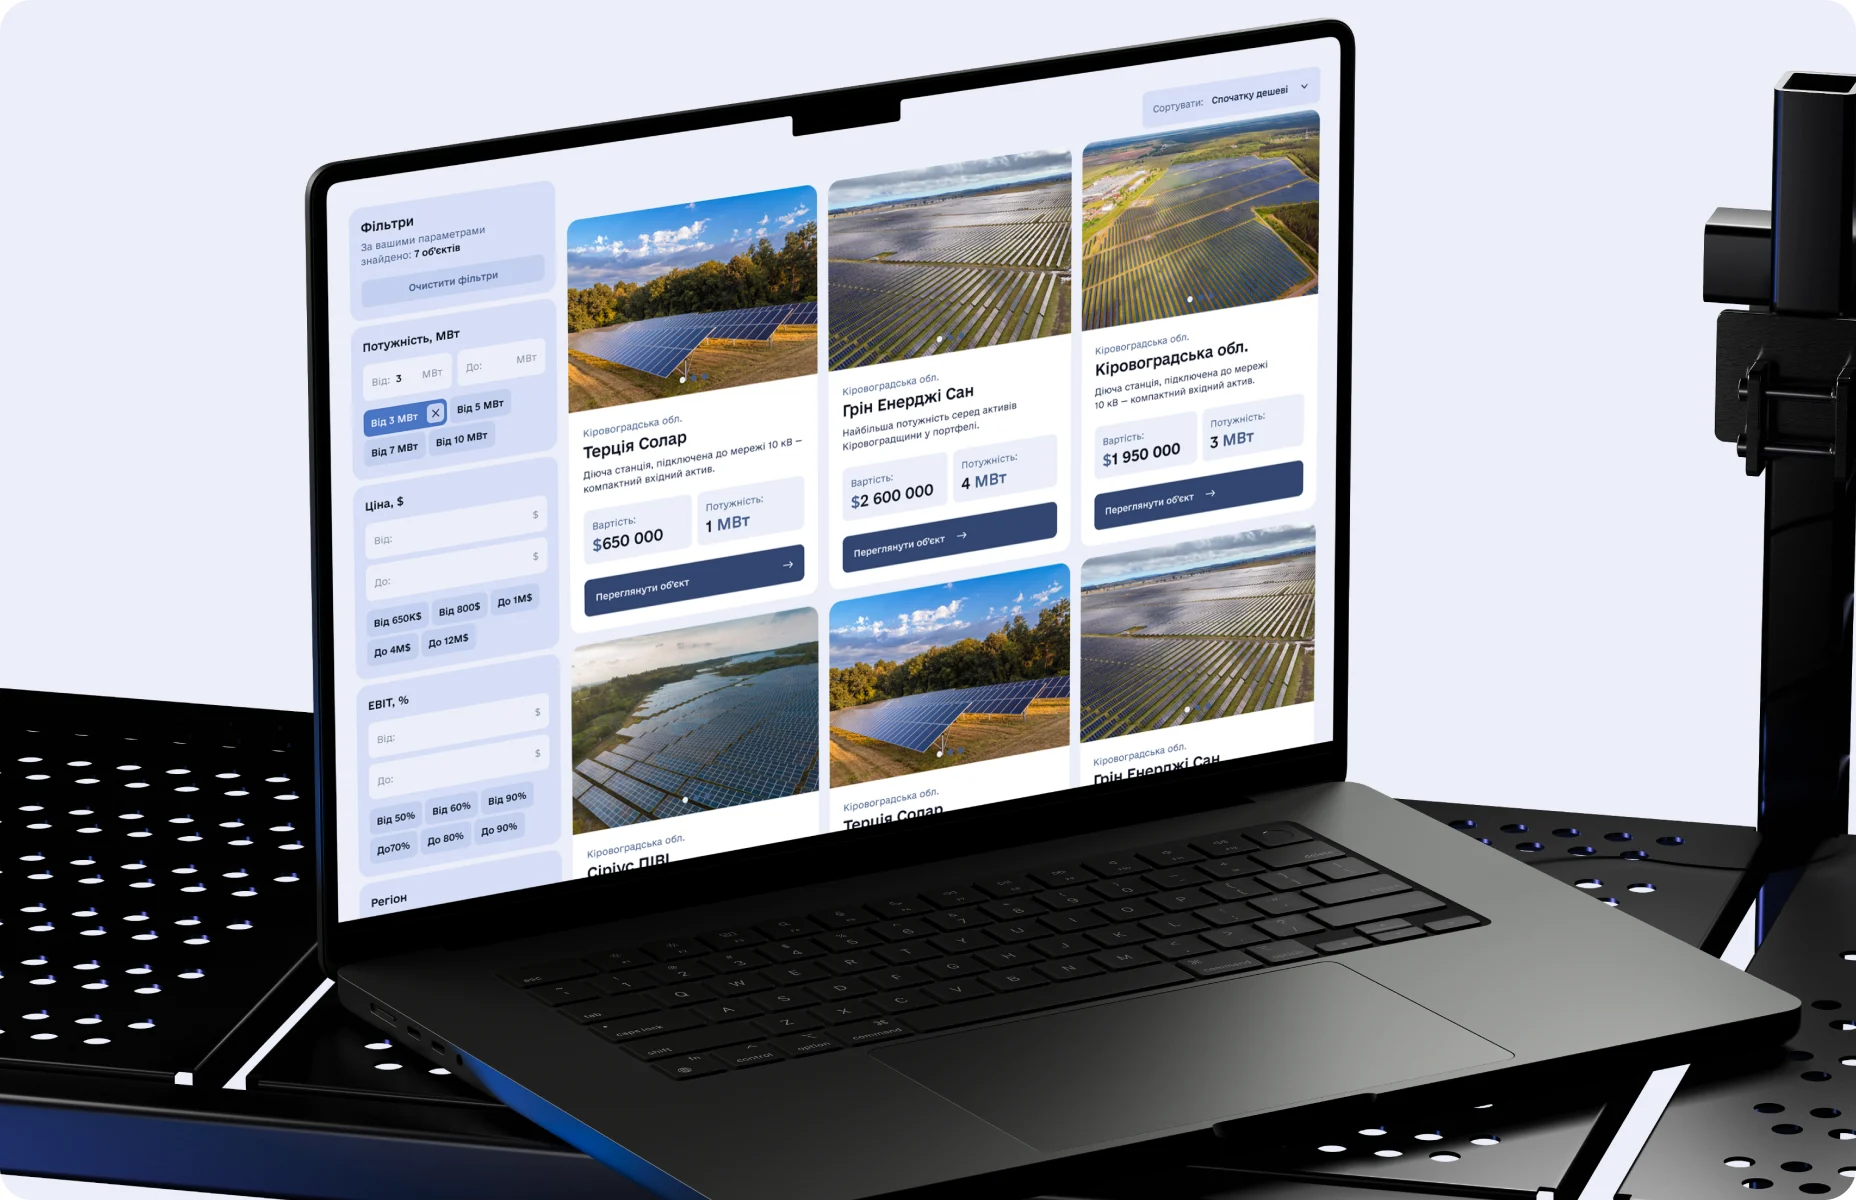
A portfolio filtered by what matters.
Investors filter the solar plant portfolio by its key parameters.
05Explain
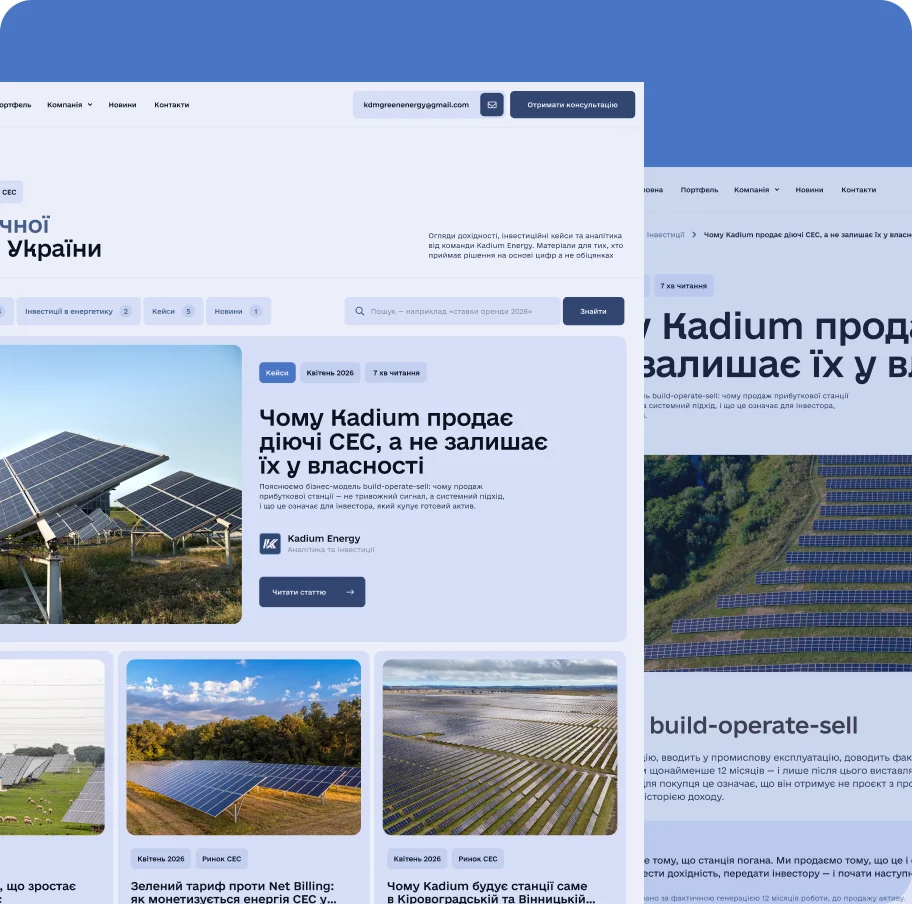
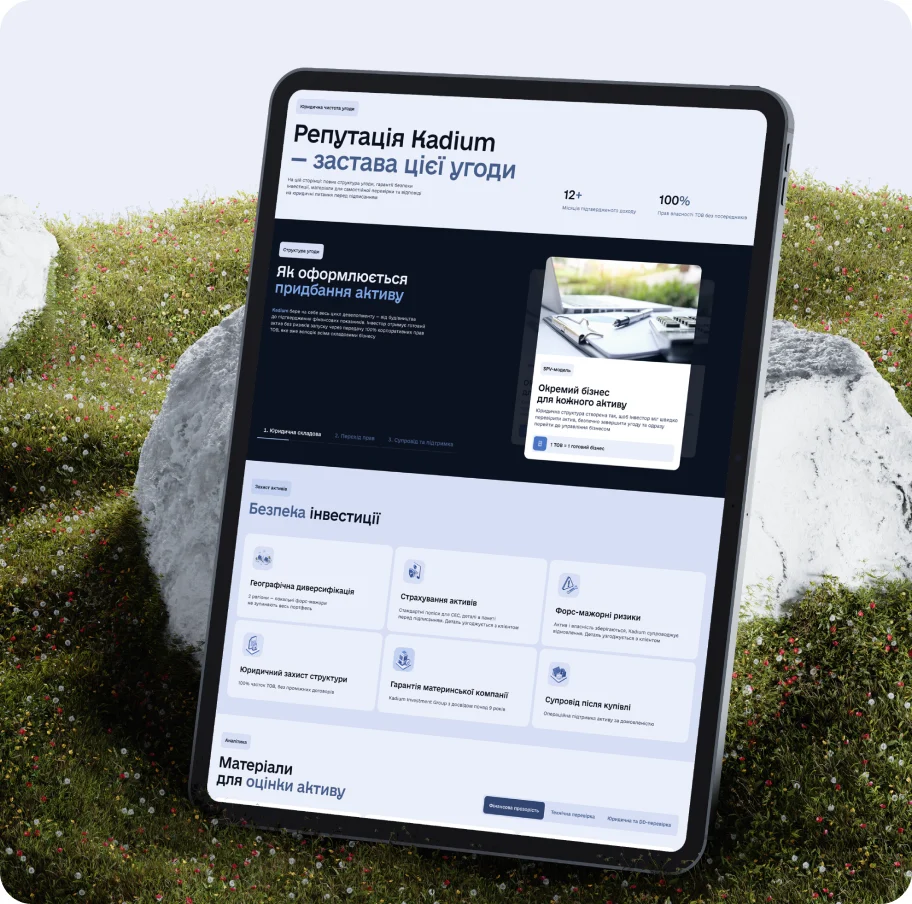
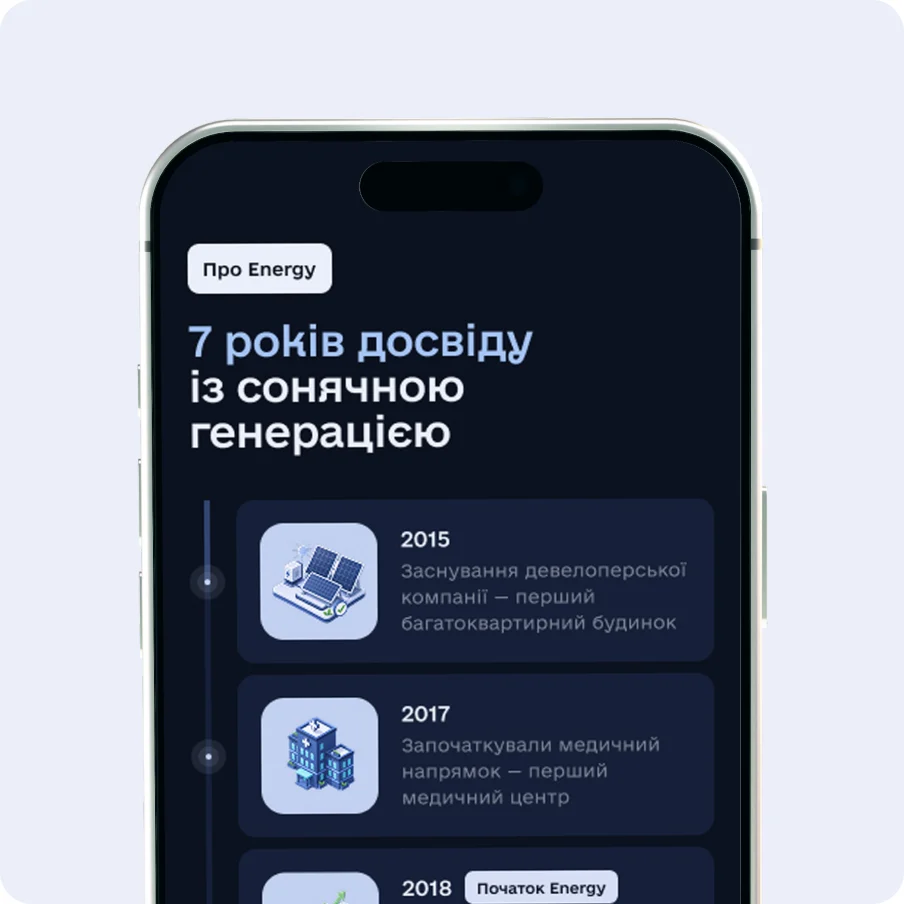
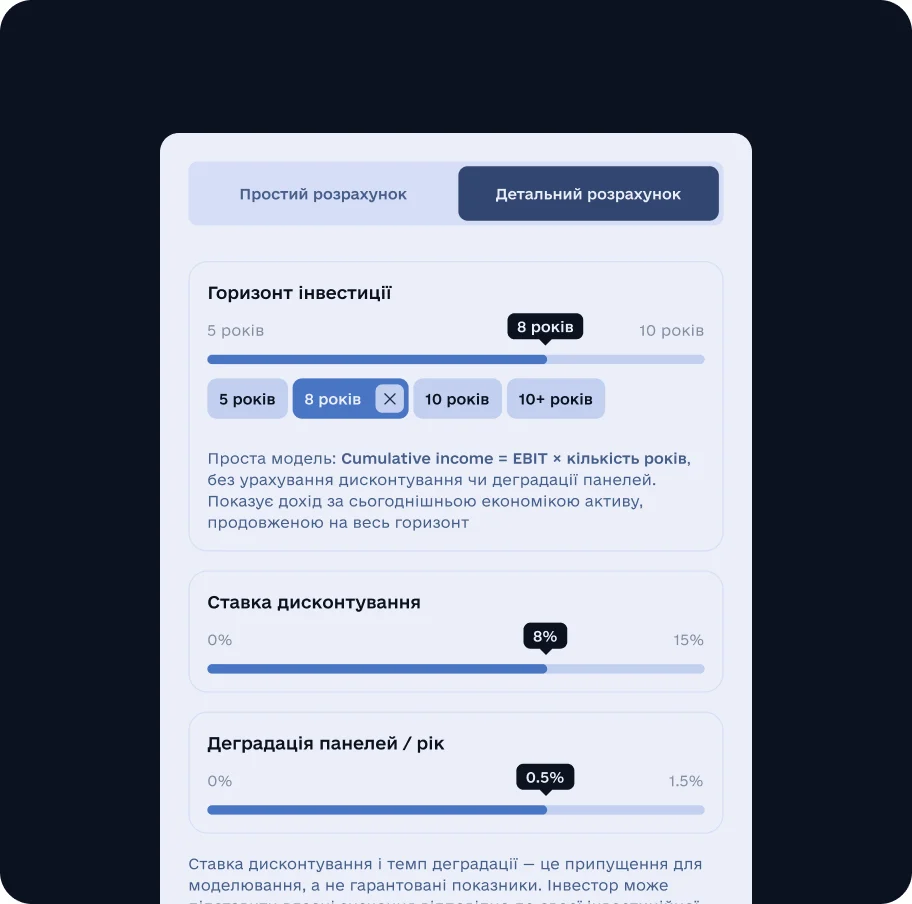
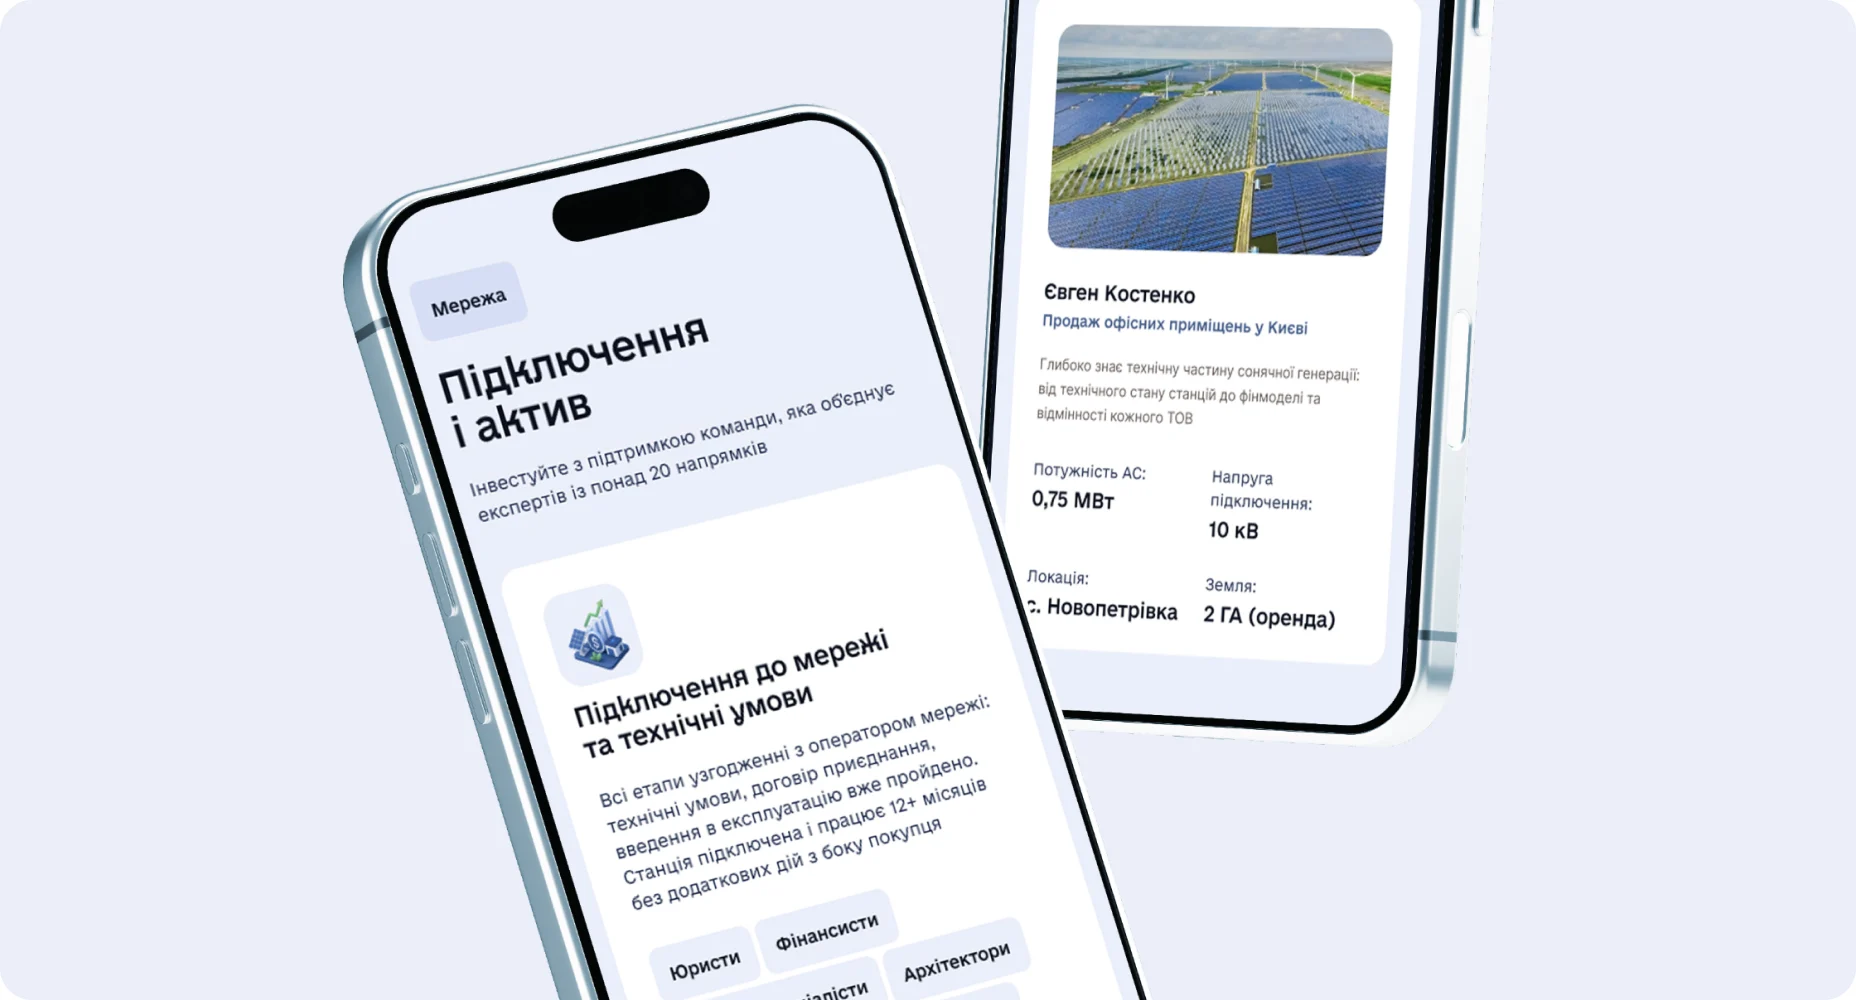
Content that explains the market.
Pages and articles explain the market, the assets and the logic of investing in solar energy.